In manufacturing, every second counts, and the cost of delay adds up fast. Real-time production data turns today’s shop floors from reactive to proactive, helping teams see issues sooner, act faster, and keep value flowing.
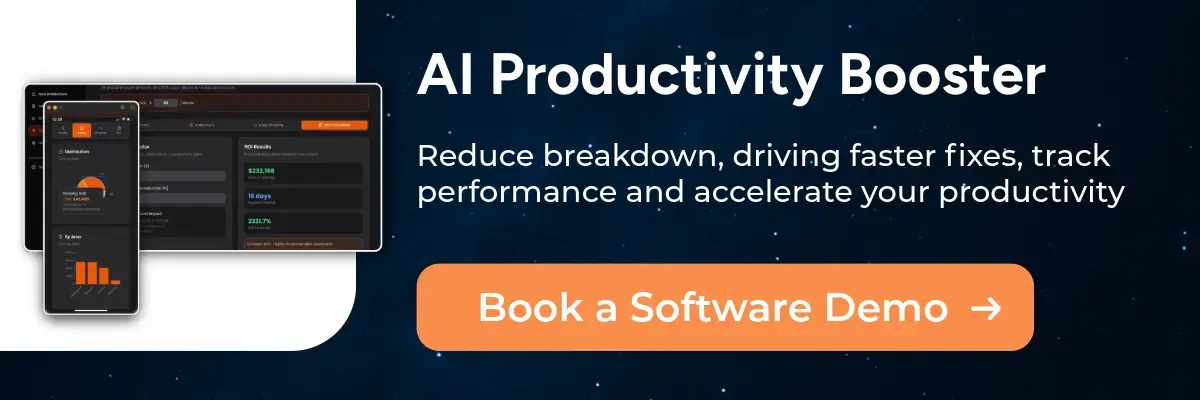
This article unpacks what “real-time” actually looks like on a modern line, how it improves day-to-day decisions, and a practical 30-60-90 day playbook you can use to get started without the jargon or the hype. It’s written in the spirit of Lean Learning Collective’s approach: Human + AI collaboration, building fast, operating lean, and using automation where it truly wins with our SmartStop Production Data solution.

What “Real-Time Production Data” looks like on your factory floor.
Real-time data is live visibility into what matters most:
- Machines: performance, micro-stoppages, and early signals of failure
- People: skills coverage, training gaps, and response times
- Materials: stock levels, changeover readiness, and waste hot-spots
- Energy: usage per SKU, line, or shift so you can spot anomalies quickly
With this in place, teams can see a problem as it forms, not hours later in a daily report.
Faster, smarter decisions (that prevent downtime.)
When a filler starts drifting, a sensor sees it immediately. Operators get a clear alert, maintenance gets context, and the line slows safely for a planned intervention rather than a sudden stop. It’s the difference between a 6-minute adjustment and a 6-hour breakdown.
The same logic applies beyond machines. If an inbound pallet is delayed, real-time impact analysis lets planners reshuffle the schedule before the delay causes a ripple effect. The outcome: less firefighting, more flow.
For many sites, even modest reductions in unplanned stops are significant. High-speed bottling plants can lose £5,121–£30,000 per hour of downtime—one example model shows losses of ~£9.4m annually for a 4-line plant, where a 40% reduction could equate to ~£3.8m in savings.
Optimising processes and reducing waste.
Real-time data exposes the small frictions that erode OEE:
- Bottlenecks across stages in the route card
- Changeovers that overrun due to missing materials or unclear standards
- Quality drift (fill level, torque, label position) flagged before it triggers rework
- Energy spikes that suggest asset issues or poor sequencing
It also improves inventory discipline. Instead of overproducing “just in case,” you can align output with demand signals and material availability, cutting working capital and scrap.
For SMEs, these gains are not theoretical. Many experience 5 hours of unplanned stoppage per month, often translating to ~£30k per year in avoidable cost.
See the bigger picture.
Real-time data doesn’t replace lean thinking; it strengthens it. By connecting assets, people, and materials into one transparent view, you can:
- Align teams around a shared single source of truth
- Run shorter PDCA cycles because feedback is instant
- Plan with confidence, using evidence over intuition
At Lean Learning Collective, we care about making advanced tech practical and profit-driving for manufacturing SME so your people remain at the heart of improvement, and AI simply amplifies their impact. That’s Human + AI collaboration in action.
A practical 30-60-90 day playbook.
Days 0–30: Baseline & focus.
- Pick one value stream (or one line/asset family) with clear pain.
- Define a north-star metric (e.g., OEE or changeover time) and 3–5 supporting signals (micro-stops, first-time yield, energy per unit).
- Instrument the basics: capture states (run/stop), speed, rejects, and simple operator inputs.
- Stand up a visible dashboard at the line and in the daily stand-up.
- Create an escalation path: what triggers an alert, who responds, what “good” looks like.
Days 31–60: Stabilise & standardise.
- Convert frequent issues into standards (quick-wins, one-point lessons, checklists).
- Introduce targeted alerts (e.g., drift beyond control limits, repeated minor stops).
- Close the loop: every alert becomes a small kaizen with an owner and due date.
- Measure and share wins (minutes saved, scrap reduced, energy per unit improved).
Days 61–90: Scale & integrate.
- Extend to a second asset (or parallel line) with similar failure modes.
- Connect real-time signals to planning (materials readiness, changeover windows).
- Codify the playbook so new teams can replicate without heroics.
- Review ROI: time saved, cost avoided, throughput gained—and reinvest where it compounds fastest.
This cadence keeps the work small, the feedback tight, and the benefits visible.

What does this mean for your role.
- For MDs/CEOs: The value isn’t just cost avoidance, it’s resilience and controlled growth. Focus on quantifiable savings and payback under six months where possible, using real operational data to guide investment.
- For Operations/Plant Managers: Real-time visibility turns micro-stoppages into actionable insights, improves first-time-fix rates, and makes tiered visual management meaningful.
- For Engineering Managers: You’ll reduce failures with predictive maintenance, integrate cleanly with ERP/MES, and cut OEM service visits through better diagnostics and remote assistance.
Principles Worth Keeping.
- Build fast. Operate lean. Automate to win. Start small, learn quickly, and automate where it reduces waste and human error, not for its own sake.
- Human + AI collaboration. Use AI to augment people: faster decisions, clearer standards, better training. Keep the “human spark.”
- Evidence over opinion. Let the live data tell you where to look next.
A quick self-assessment checklist.
- Do we have a single source of truth for run/stop states, speed, rejects, and key quality parameters?
- Can operators see and act on live deviations (not yesterday’s report)?
- Are alerts mapped to standards (who, what, when) with follow-up learning?
- Do planning and maintenance teams use the same live view to schedule proactively?
- Can we show a simple before/after on downtime, scrap, or energy per unit from the last 90 days?
If you can’t tick these off yet, you’ve got clear first steps and quick wins waiting.

Final word
Real-time data is not about dashboards; it’s about decisions. Start with one value stream, prove the gains, and scale what works. With a lean mindset and a practical approach to AI Workflows SMEs can unlock the kind of improvements that used to be out of reach, smarter, faster, and genuinely disruptive growth.
FAQs: Real-Time Production Data in Manufacturing
What is real-time Production data?
- Real-time Production data is live information about your production process, captured and updated continuously. It can include machine performance, production rates, energy use, quality metrics, and inventory levels. This data allows manufacturers to spot issues immediately and take corrective action before problems escalate.
- How can real-time data reduce downtime in manufacturing?
Real-time Production data lets teams detect early signs of equipment failure, such as reduced speed, increased vibration, or unusual temperature, before a breakdown occurs. This enables planned maintenance instead of costly unplanned stoppages, keeping production lines running smoothly. - What are the benefits of using real-time data on the factory floor?
Key benefits include:- Faster decision-making
- Reduced downtime and waste
- Improved quality control
- Optimised inventory levels
- Increased productivity and profitability
- How does real-time data help with predictive maintenance?
By monitoring key machine parameters in real-time, you can identify patterns that indicate wear or failure. Predictive maintenance uses this information to schedule repairs at the optimal time, preventing unexpected breakdowns and extending equipment life. - Can real-time data improve lean manufacturing practices?
Yes. Real-time data strengthens lean principles by giving teams immediate feedback, enabling rapid PDCA (Plan-Do-Check-Act) cycles, reducing waste, and improving process flow. It helps make continuous improvement a daily habit. - What is the difference between real-time Production data and traditional manufacturing reports?
Traditional reports are usually generated after the fact, often hours or days later, meaning problems are spotted too late to act on immediately. Real-time data provides live visibility so you can respond to issues as they happen. - How can SMEs afford real-time Production data tools?
Modern IoT sensors, cloud platforms, and software-as-a-service models make real-time data tools accessible for SMEs. You can start small by monitoring one machine or line and scale up as you prove the return on investment. - What KPIs can be tracked using real-time production data?
Common KPIs include Overall Equipment Effectiveness (OEE), production speed, downtime (planned and unplanned), scrap/rework rates, energy consumption, and on-time delivery performance. - How does real-time Production data help reduce waste in manufacturing?
It pinpoints inefficiencies, such as overproduction, excessive scrap, or energy spikes, allowing teams to address root causes quickly. This leads to better resource use, lower costs, and a smaller environmental footprint. - How do you start using real-time Production data in a factory?
Start with:- Identifying one high-impact area (e.g., a bottleneck machine)
- Setting measurable KPIs
- Installing sensors or simple monitoring tools
- Displaying live data where teams can see it
- Creating an action plan for responding to alerts